Within the Horizon Europe project HEREDITARY (HetERogeneous sEmantic Data integratIon for the guT-bRain interplaY, GA 101137074), TU Graz works in close collaboration with several partners across the consortium, including experts in medical research, federated infrastructures, machine learning, data management and related fields, to develop innovative approaches for the visualisation of multimodal, distributed clinical and research data.
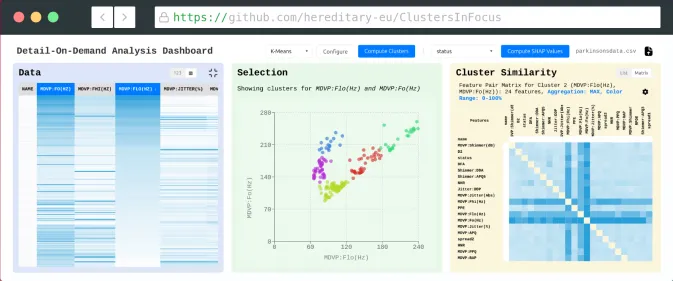
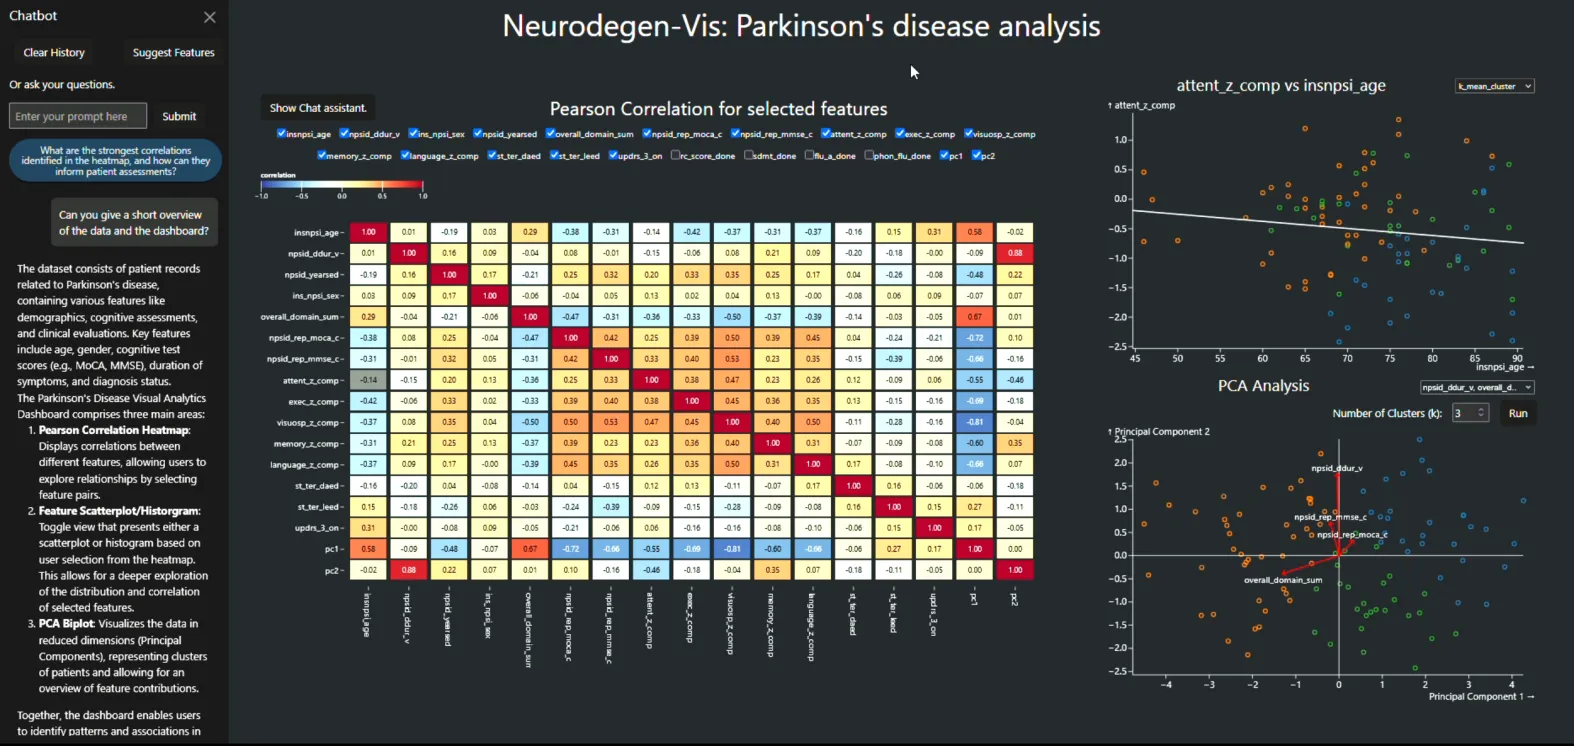
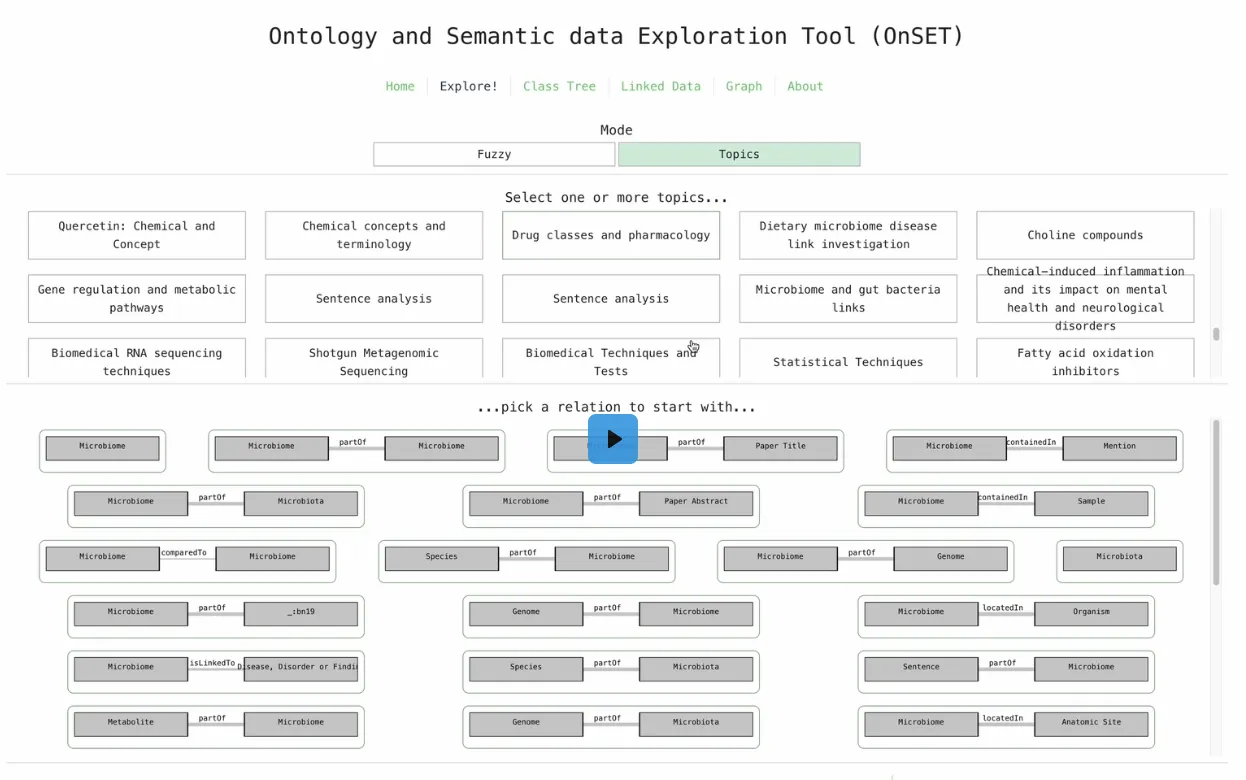
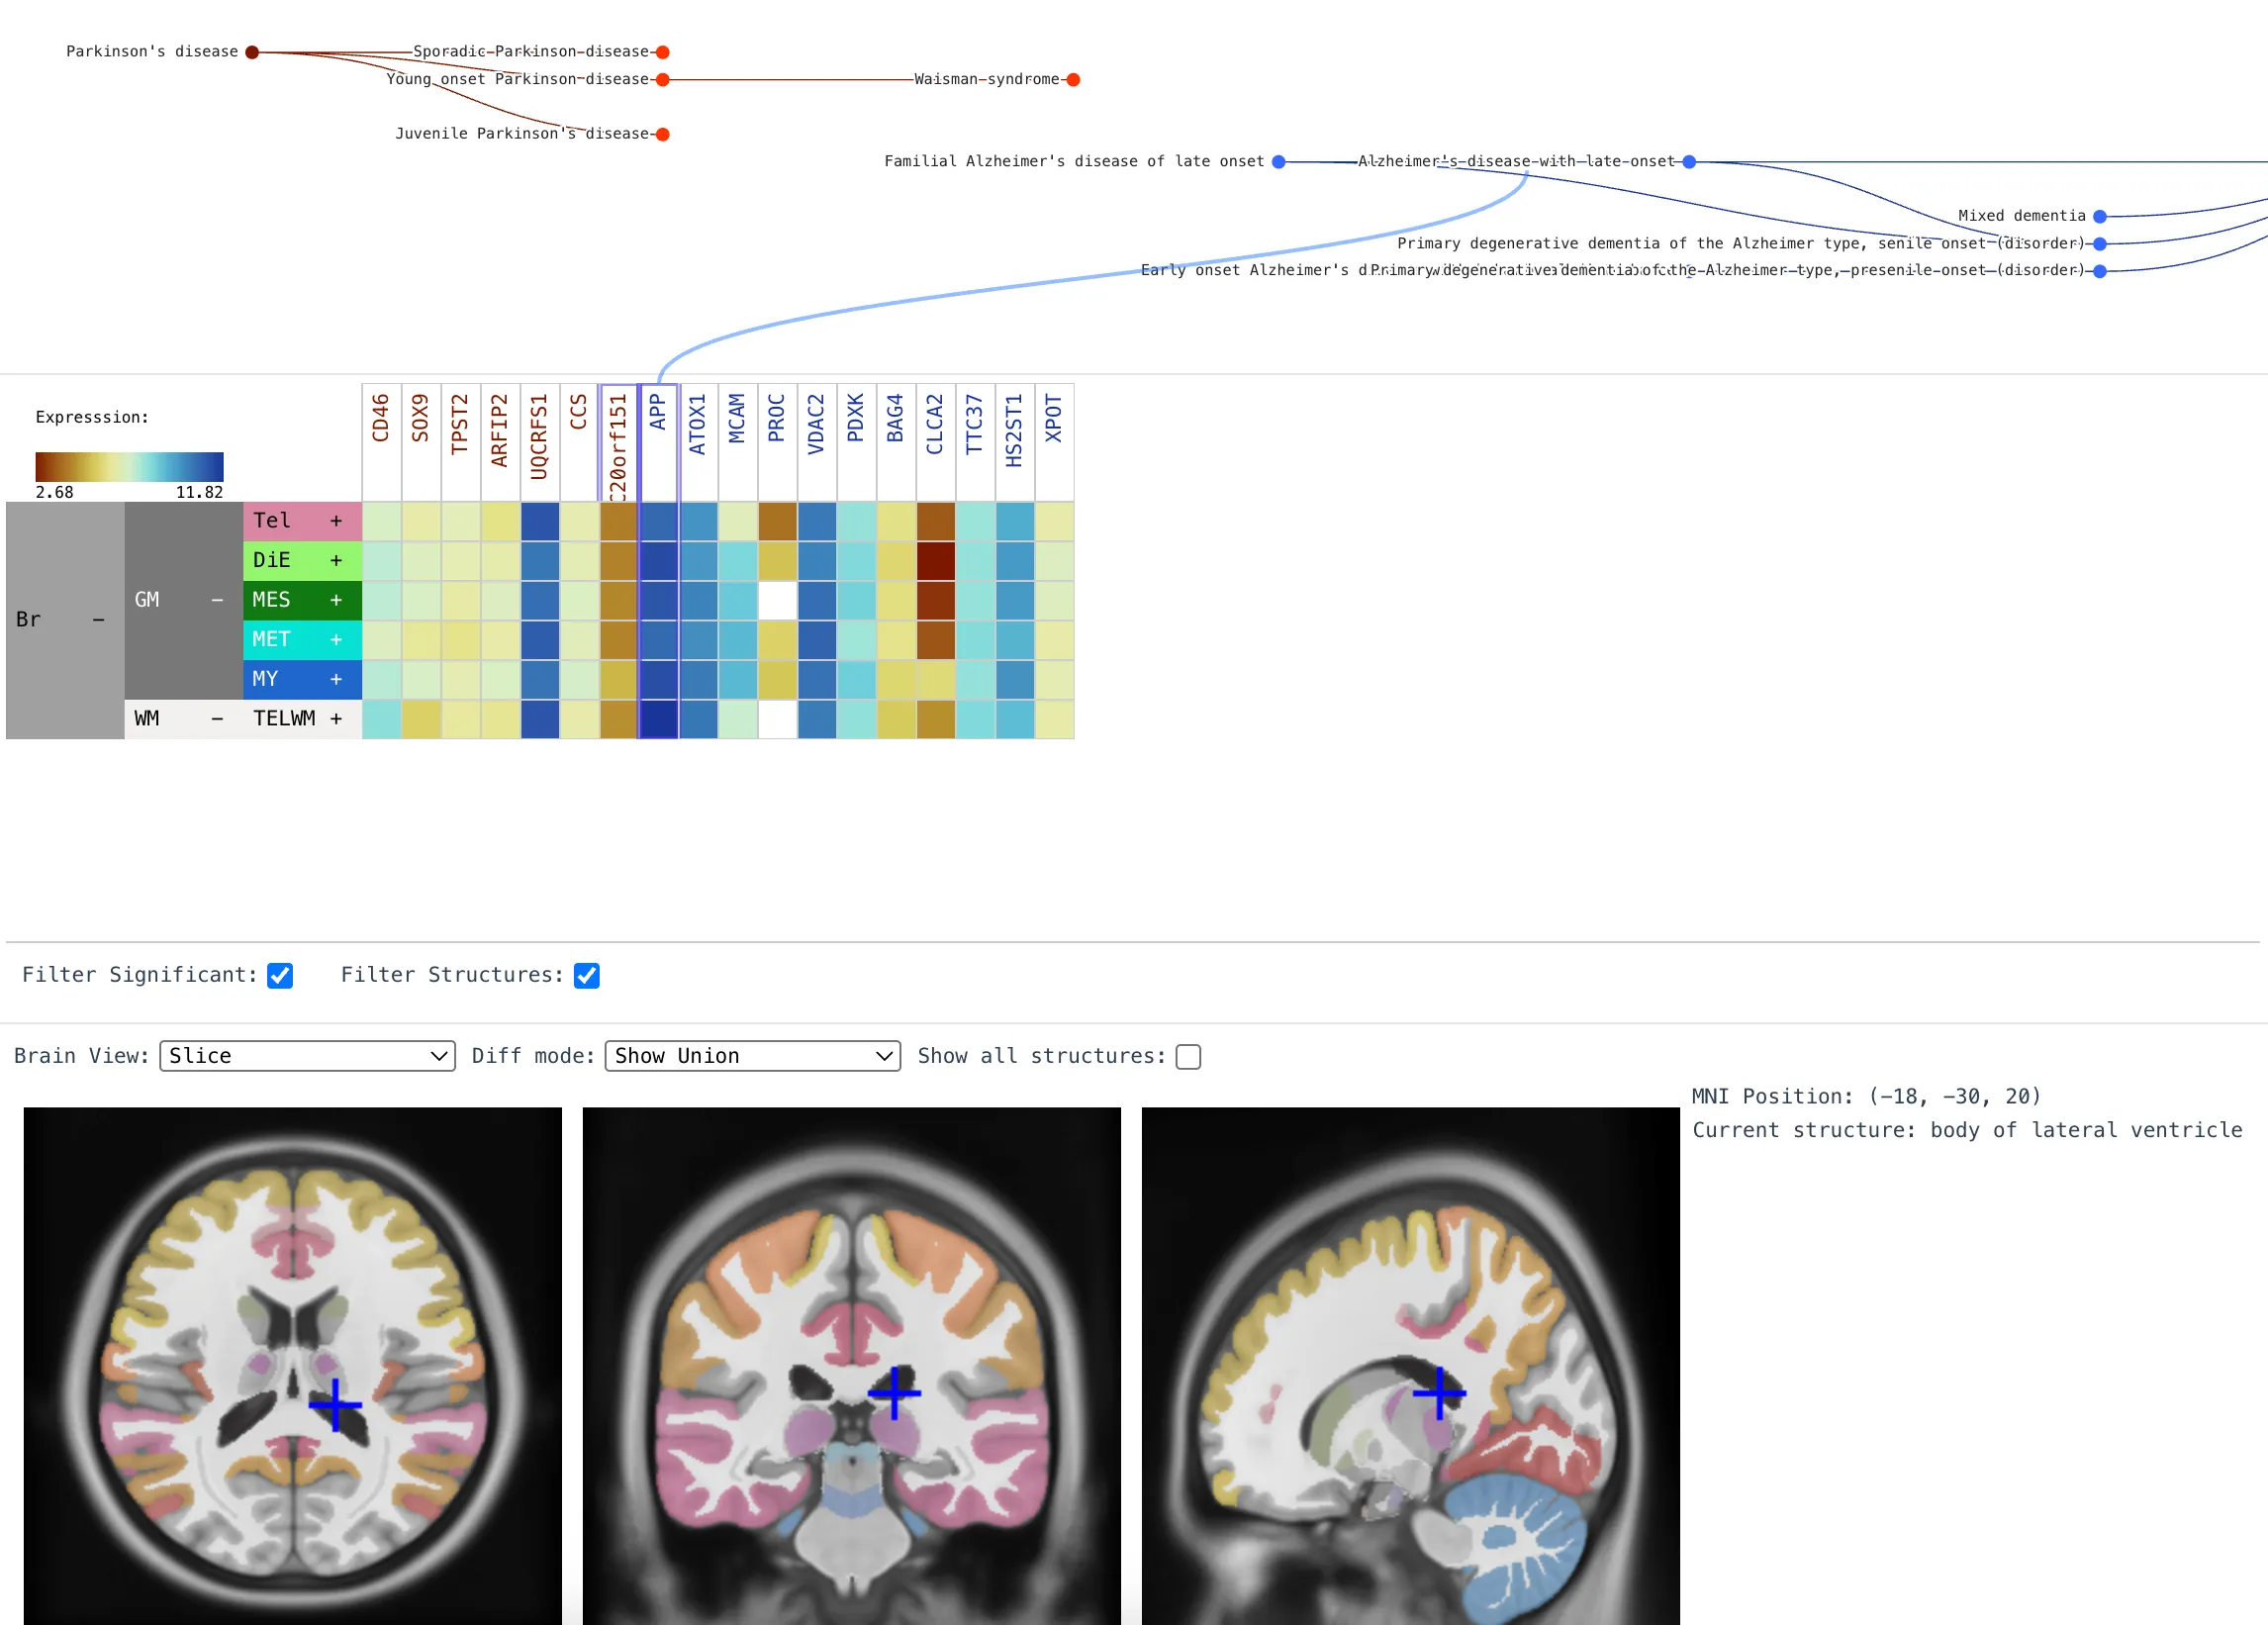
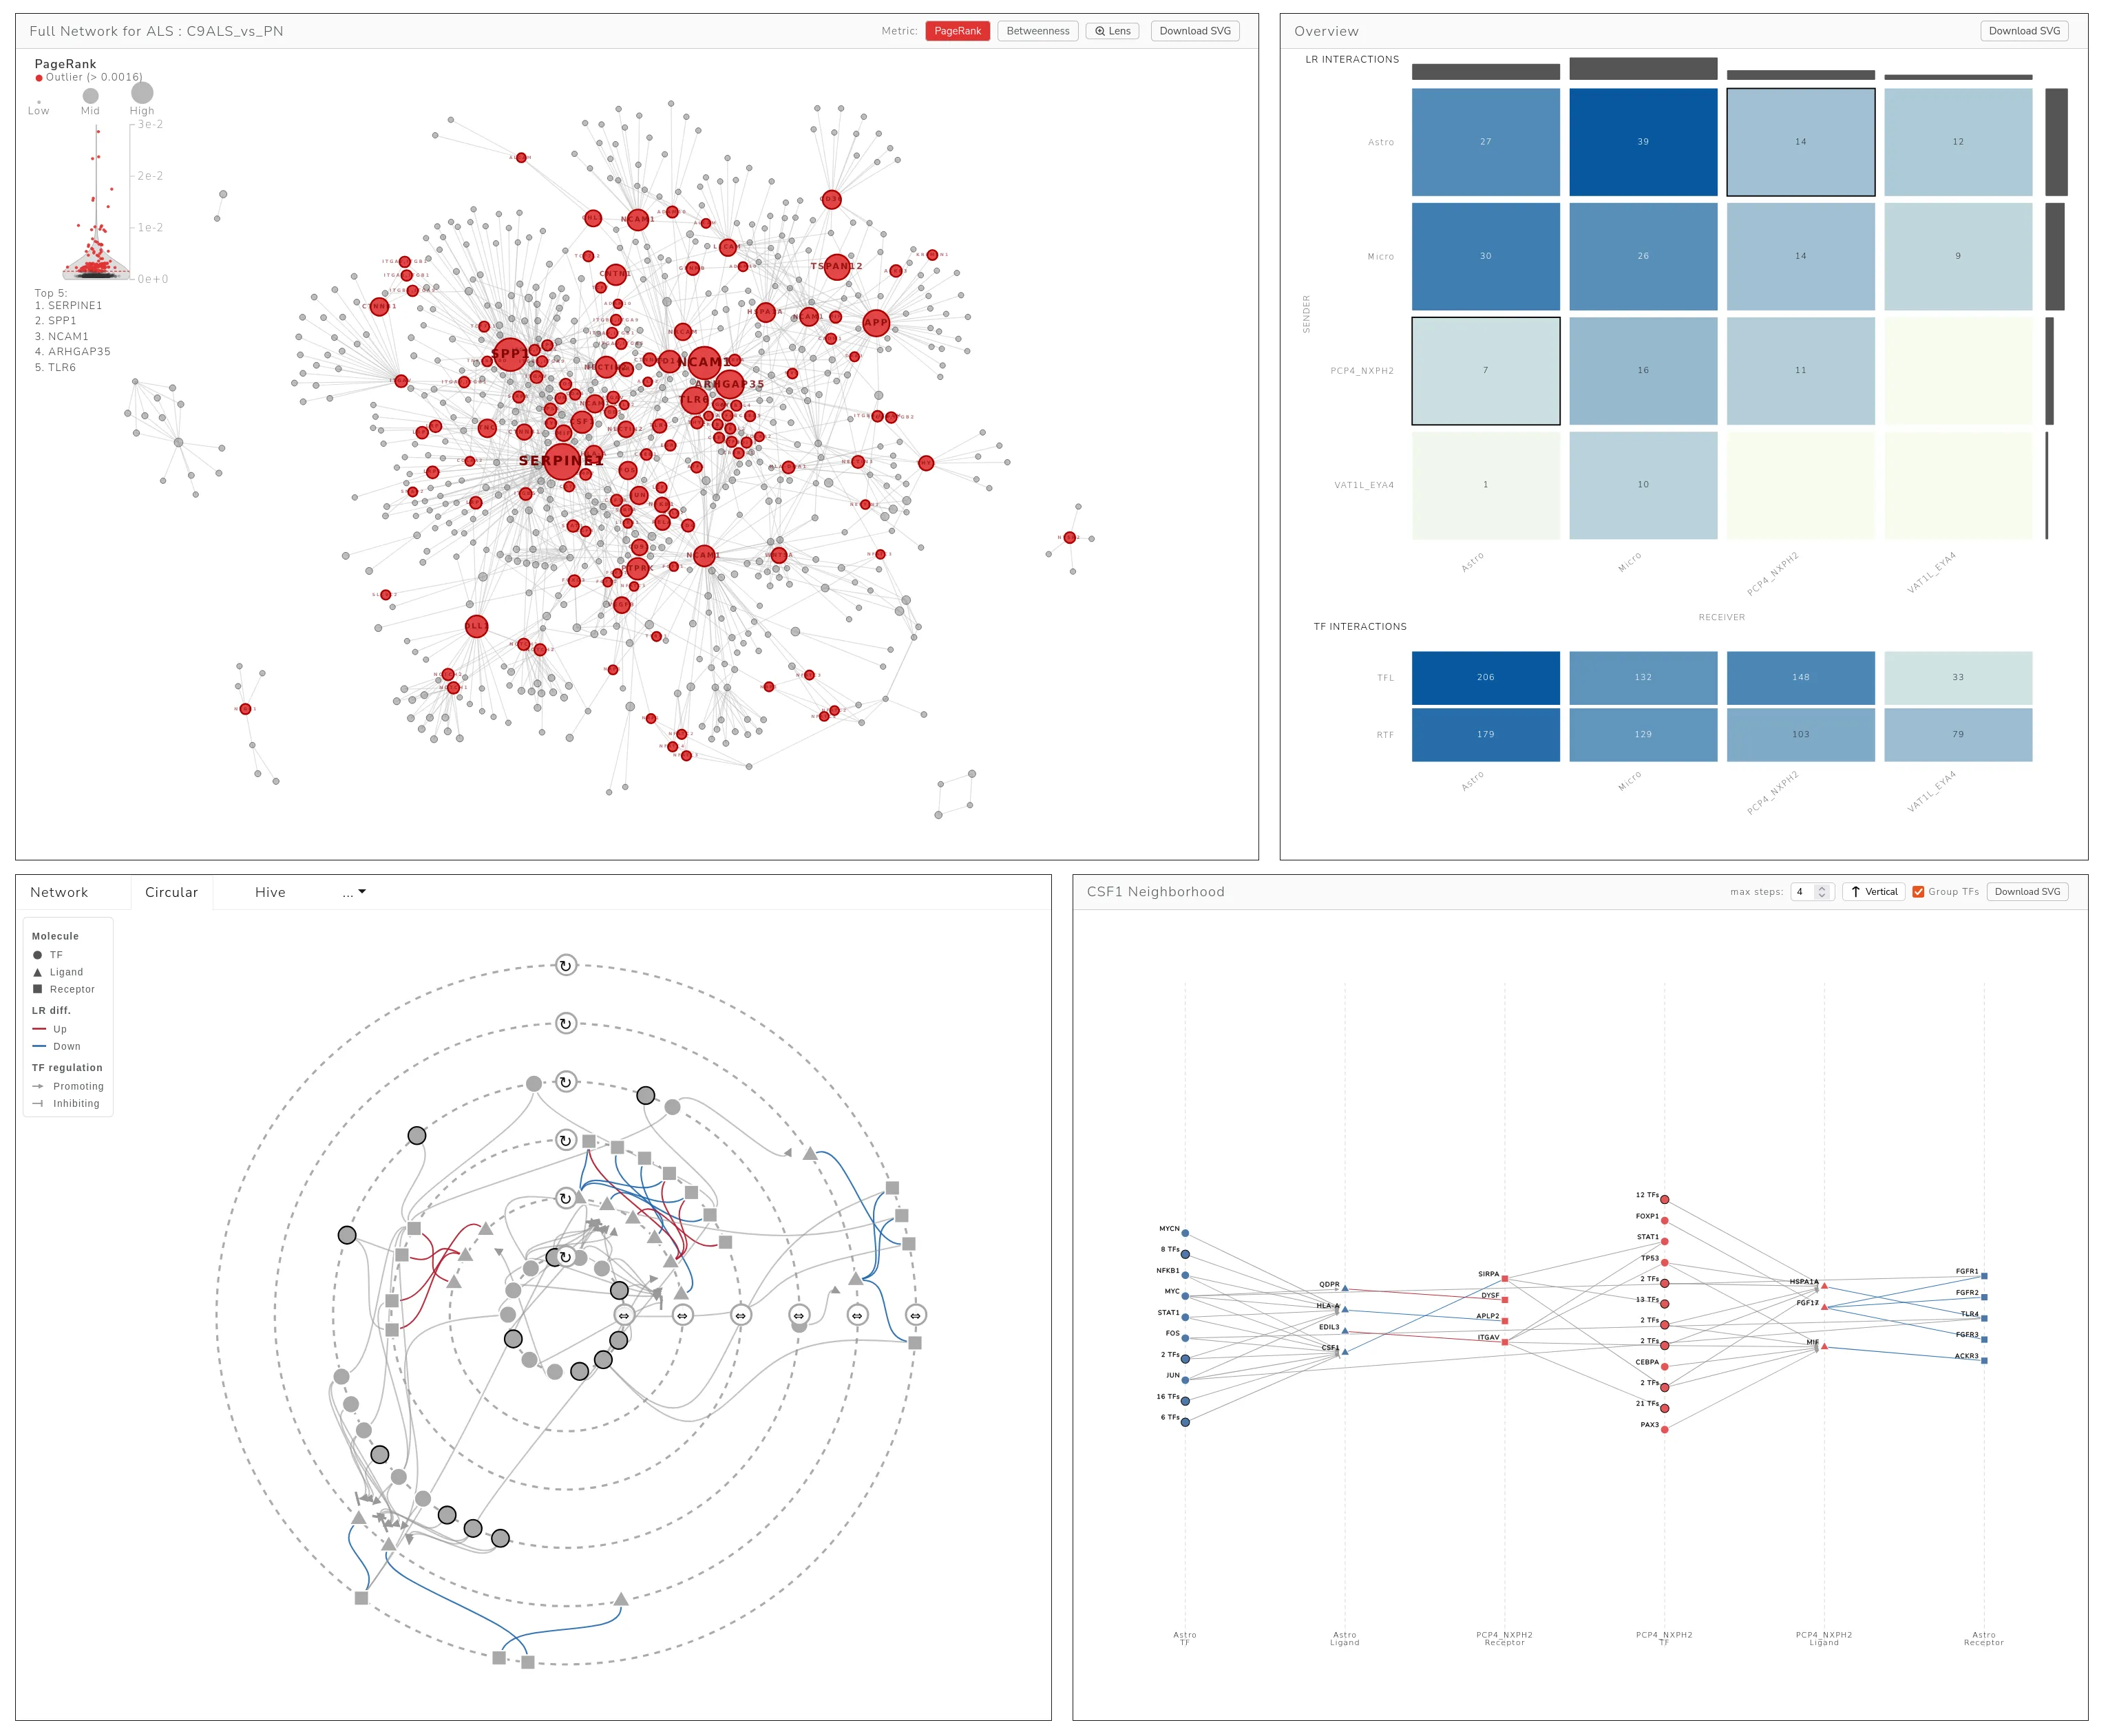
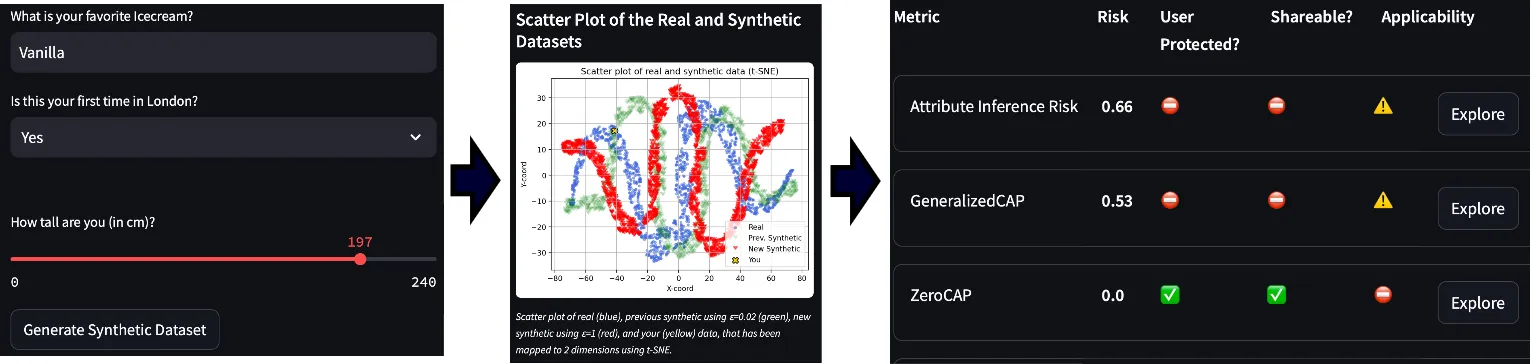
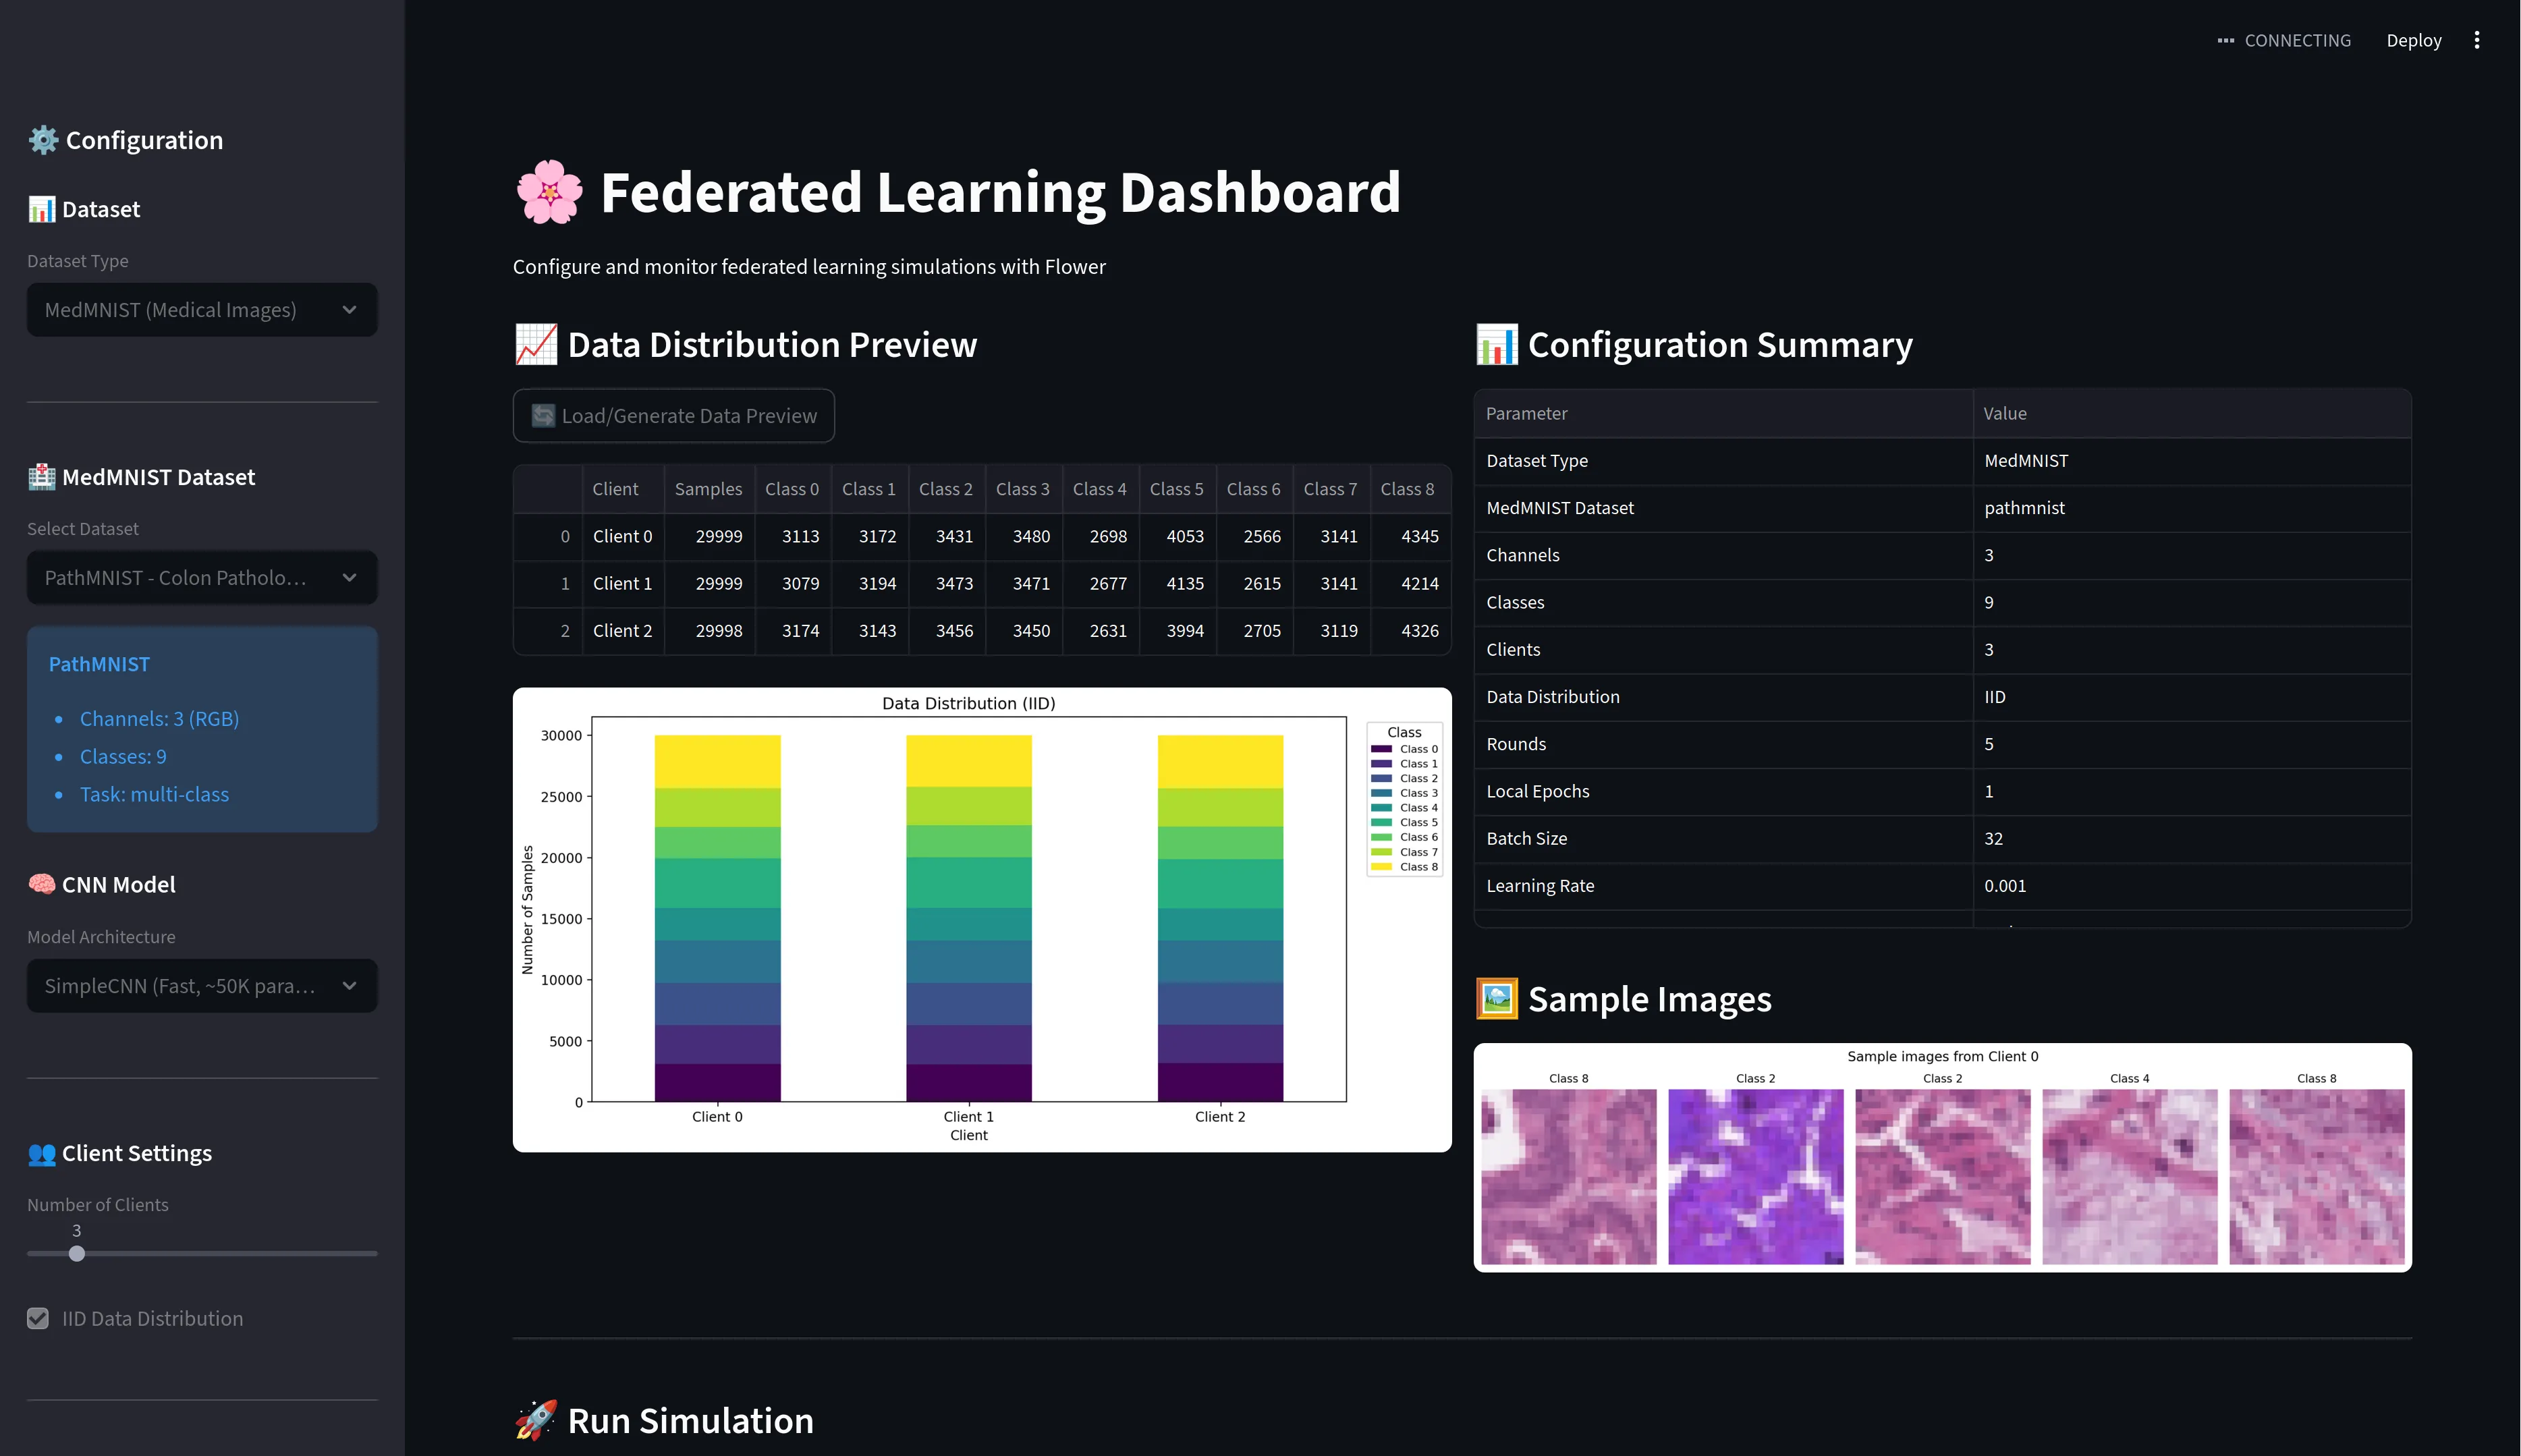
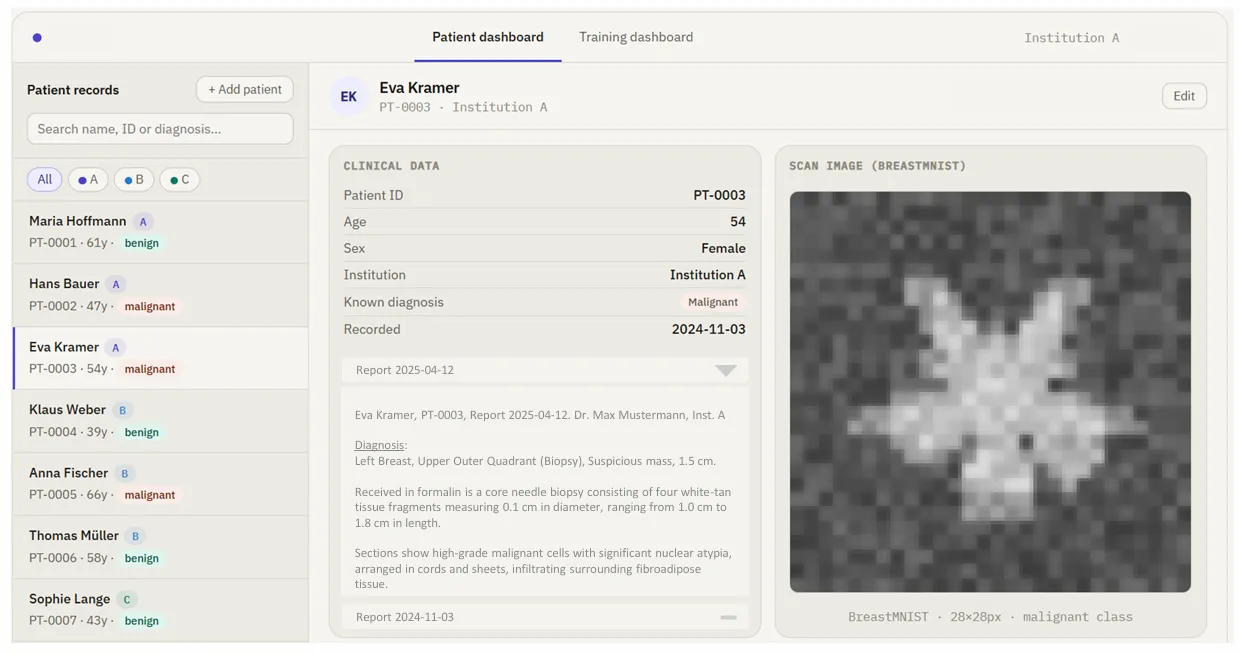
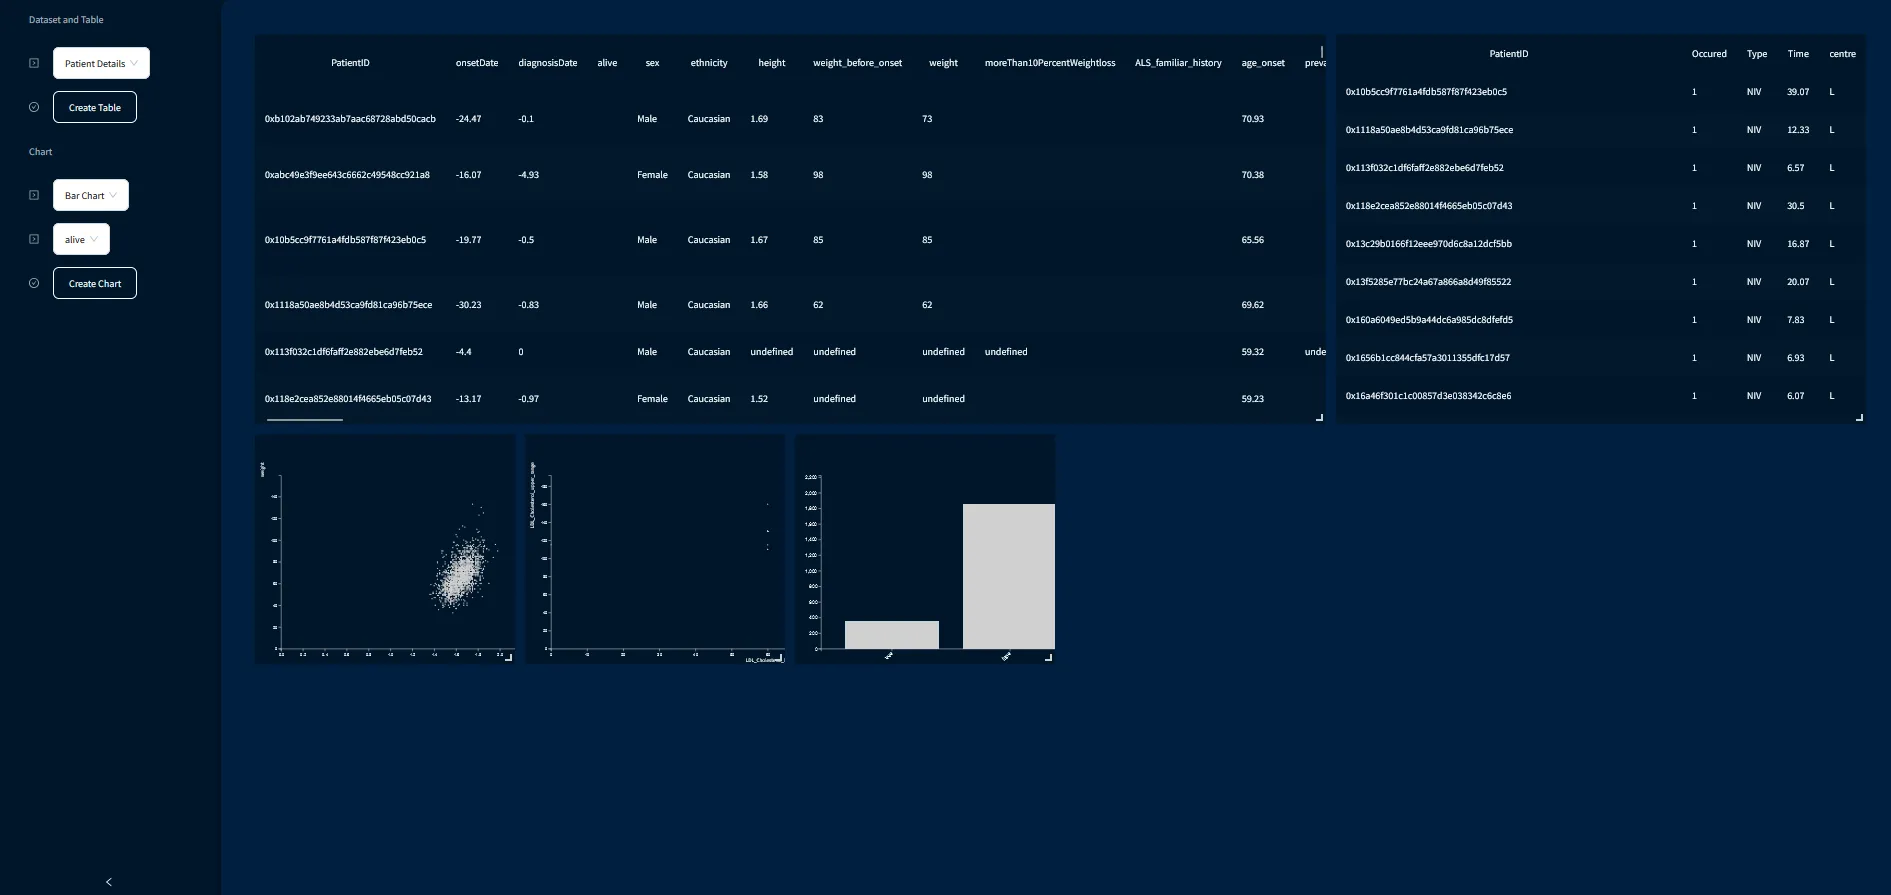
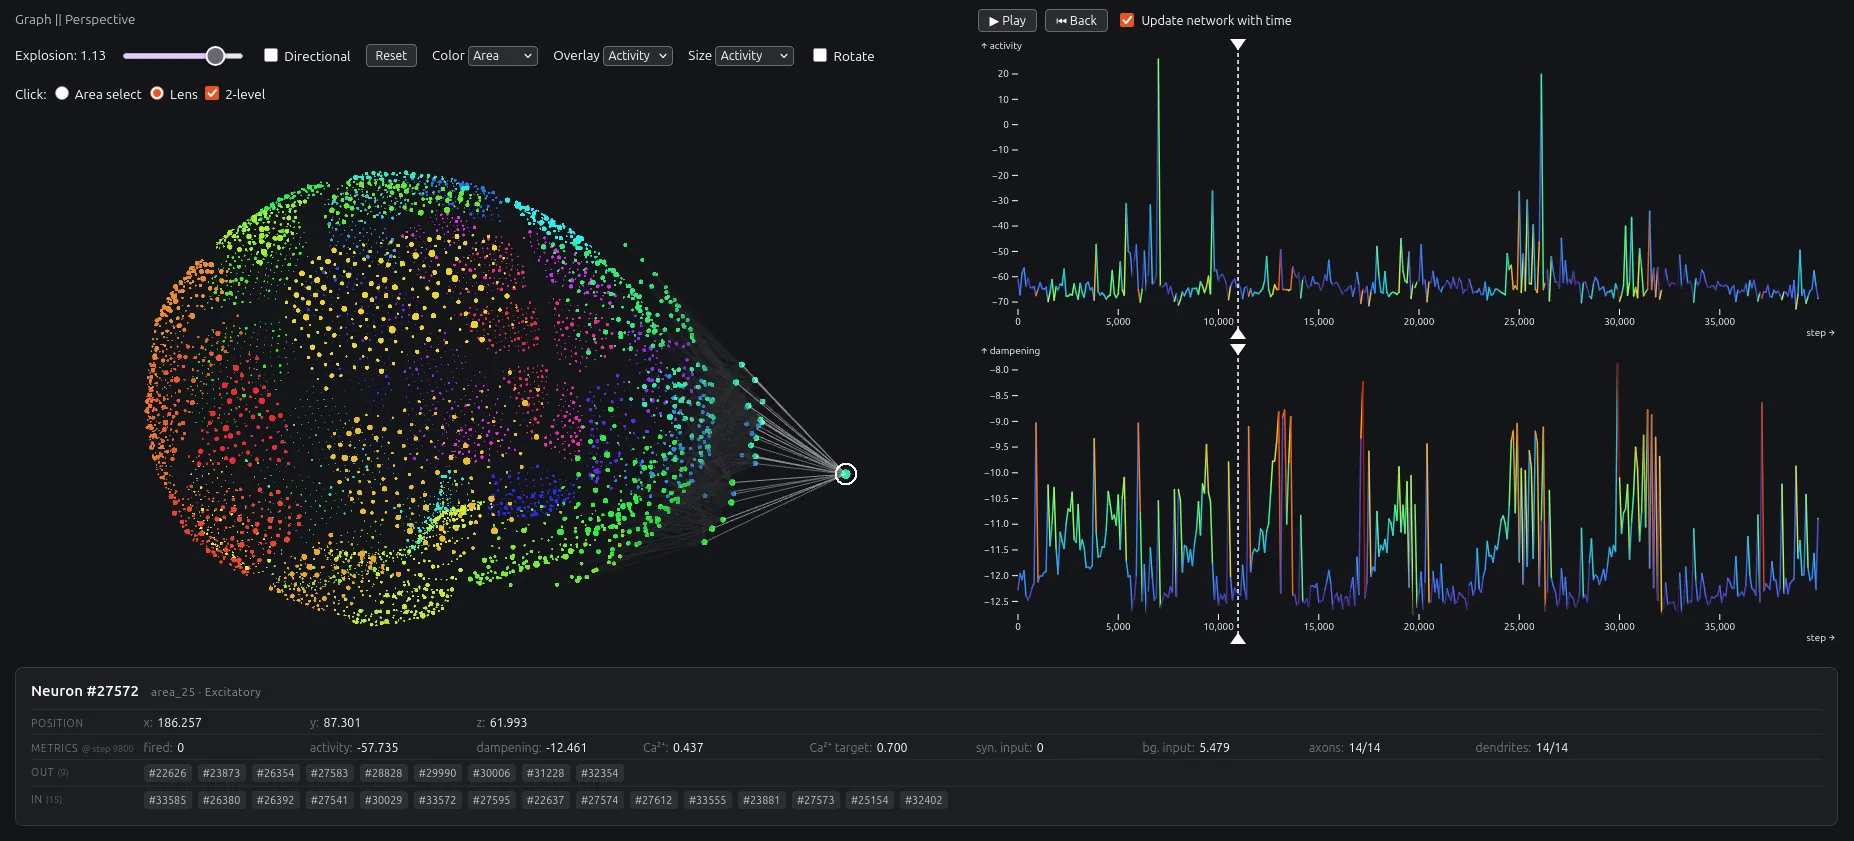
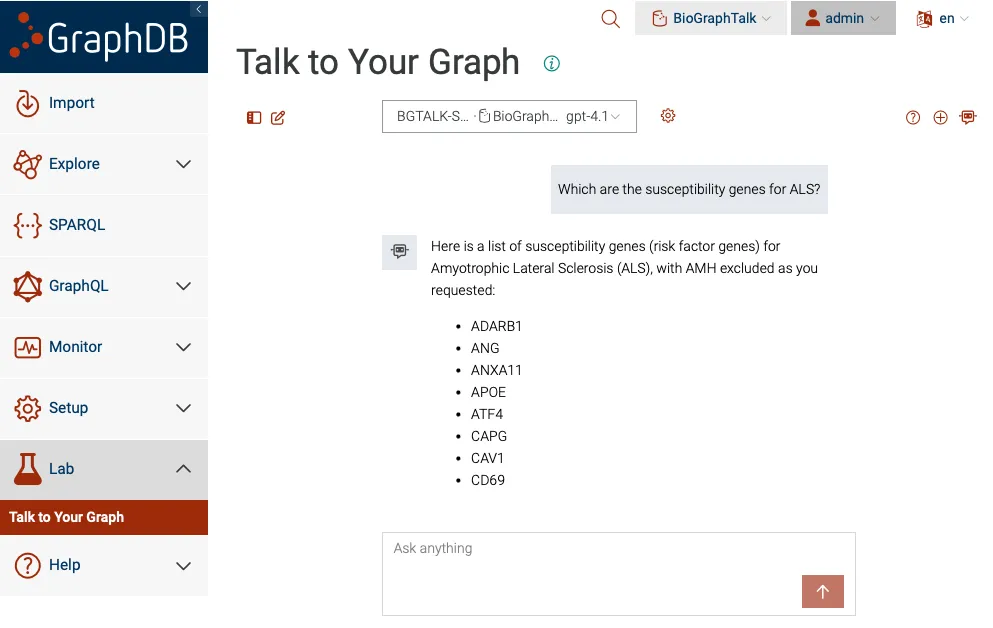
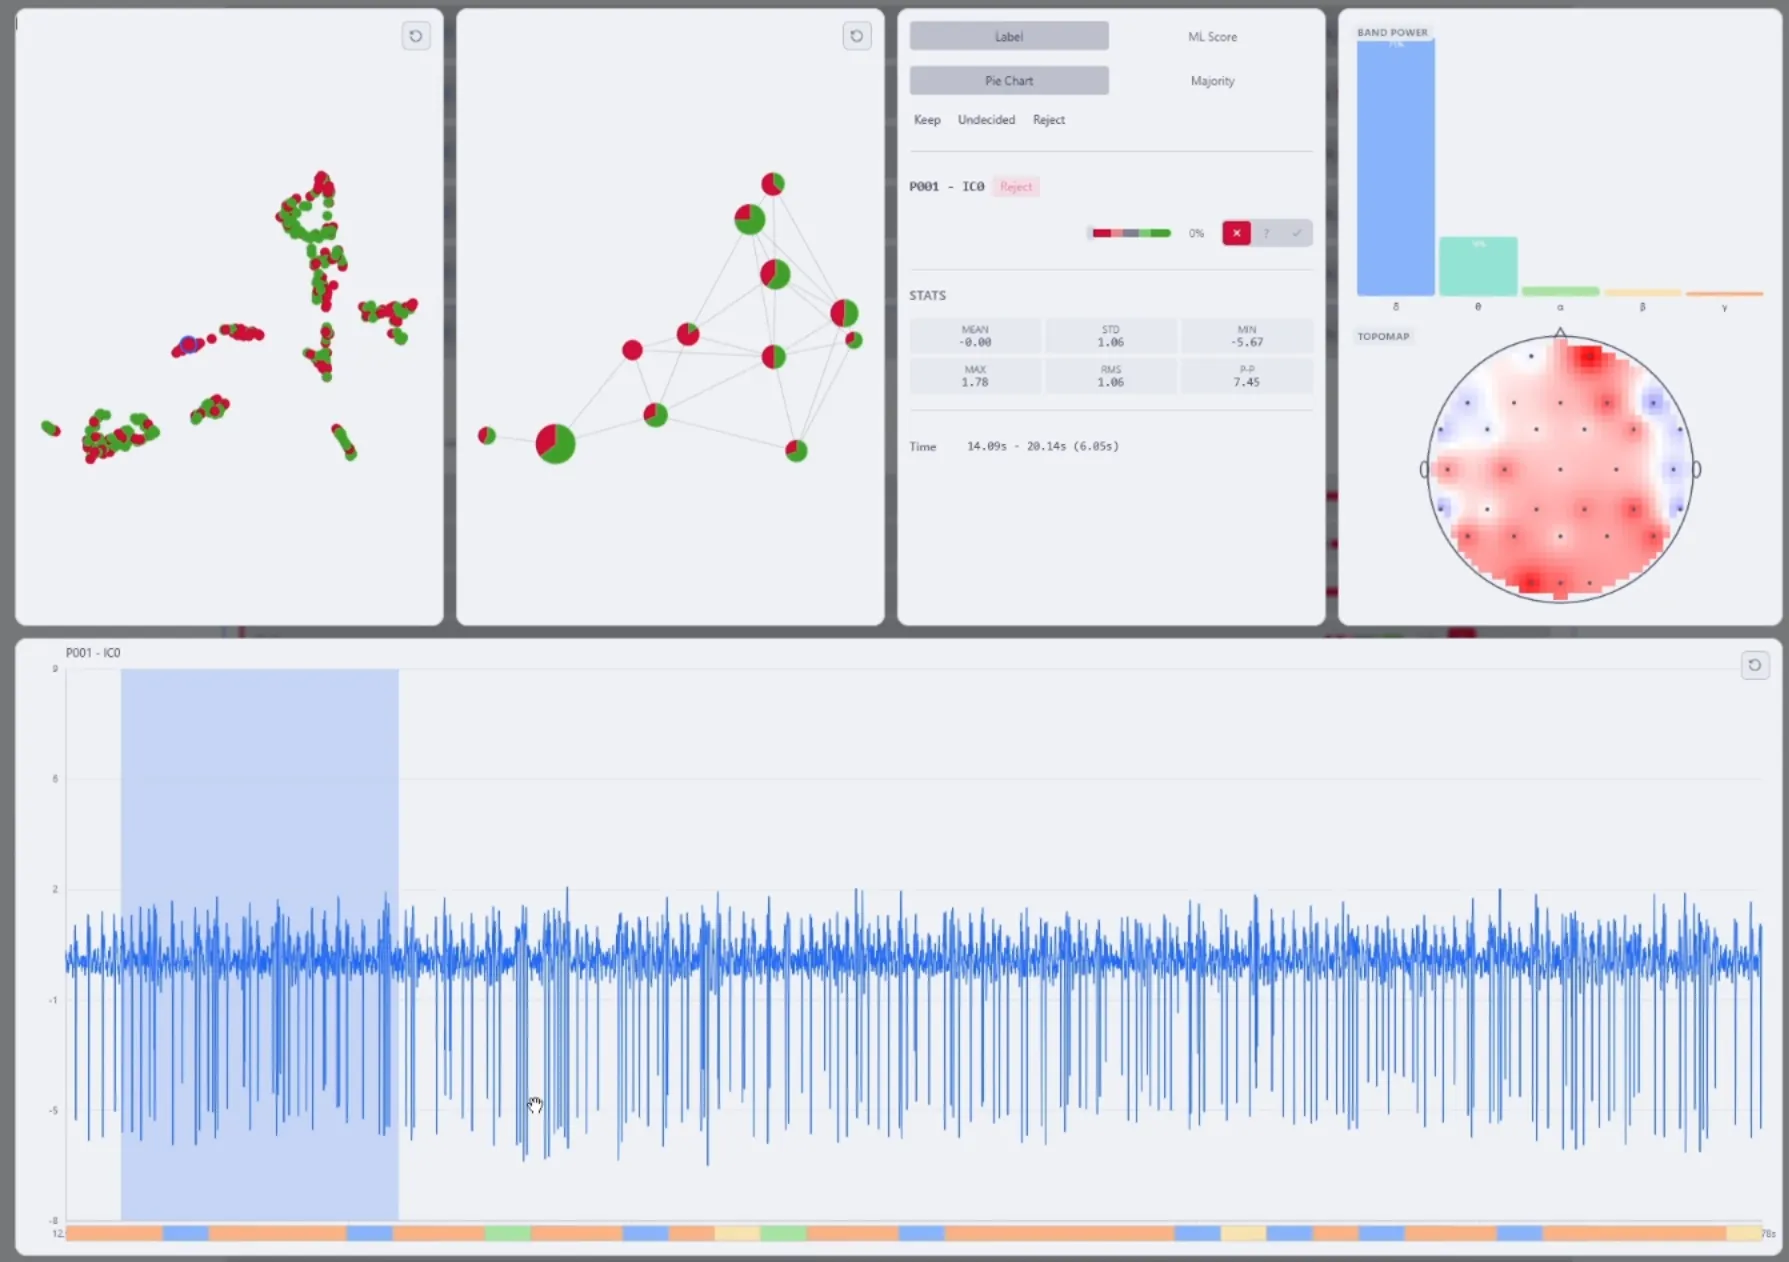
Together, they addresses key challenges in the study of neurodegenerative diseases and explores neural interactions along the gut-brain axis. This includes the development and evaluation of interactive visualisations that support the exploration of diverse medical data types, including images, biosignals, time series and high-dimensional observational data. A particular focus of this work is the integration of Large Language Model technologies, in form of conversational interfaces that help users interact with data, understand visual representations and identify meaningful patterns through natural language.
This webpage showcases a selection of the visualisation approaches being developed within the HEREDITARY project, making them accessible for exploration by interested users in a wider community.