Differential Cell Signaling
An interactive dashboard for exploring differential cell-signaling networks by integrating cell-cell communication inference with transcription factor (TF) activities inferred from scRNA-seq. It highlights the ligands, receptors, TFs, and cell types that drive disease mechanisms, traces signaling loops, and supports on-the-fly GO, KEGG, and Reactome over-representation analyses. An Amyotrophic Lateral Sclerosis (ALS) case study is included, enabling the biomedical inspection of sporadic ALS, familial ALS, and their contrasts.
Differential Signaling Visual Analytics Dashboard
Interactive visual analytics framework for the exploration of differential cell-cell communication (CCC) and transcription factor (TF) activity inferred from single-cell RNA sequencing (scRNA-seq) data.
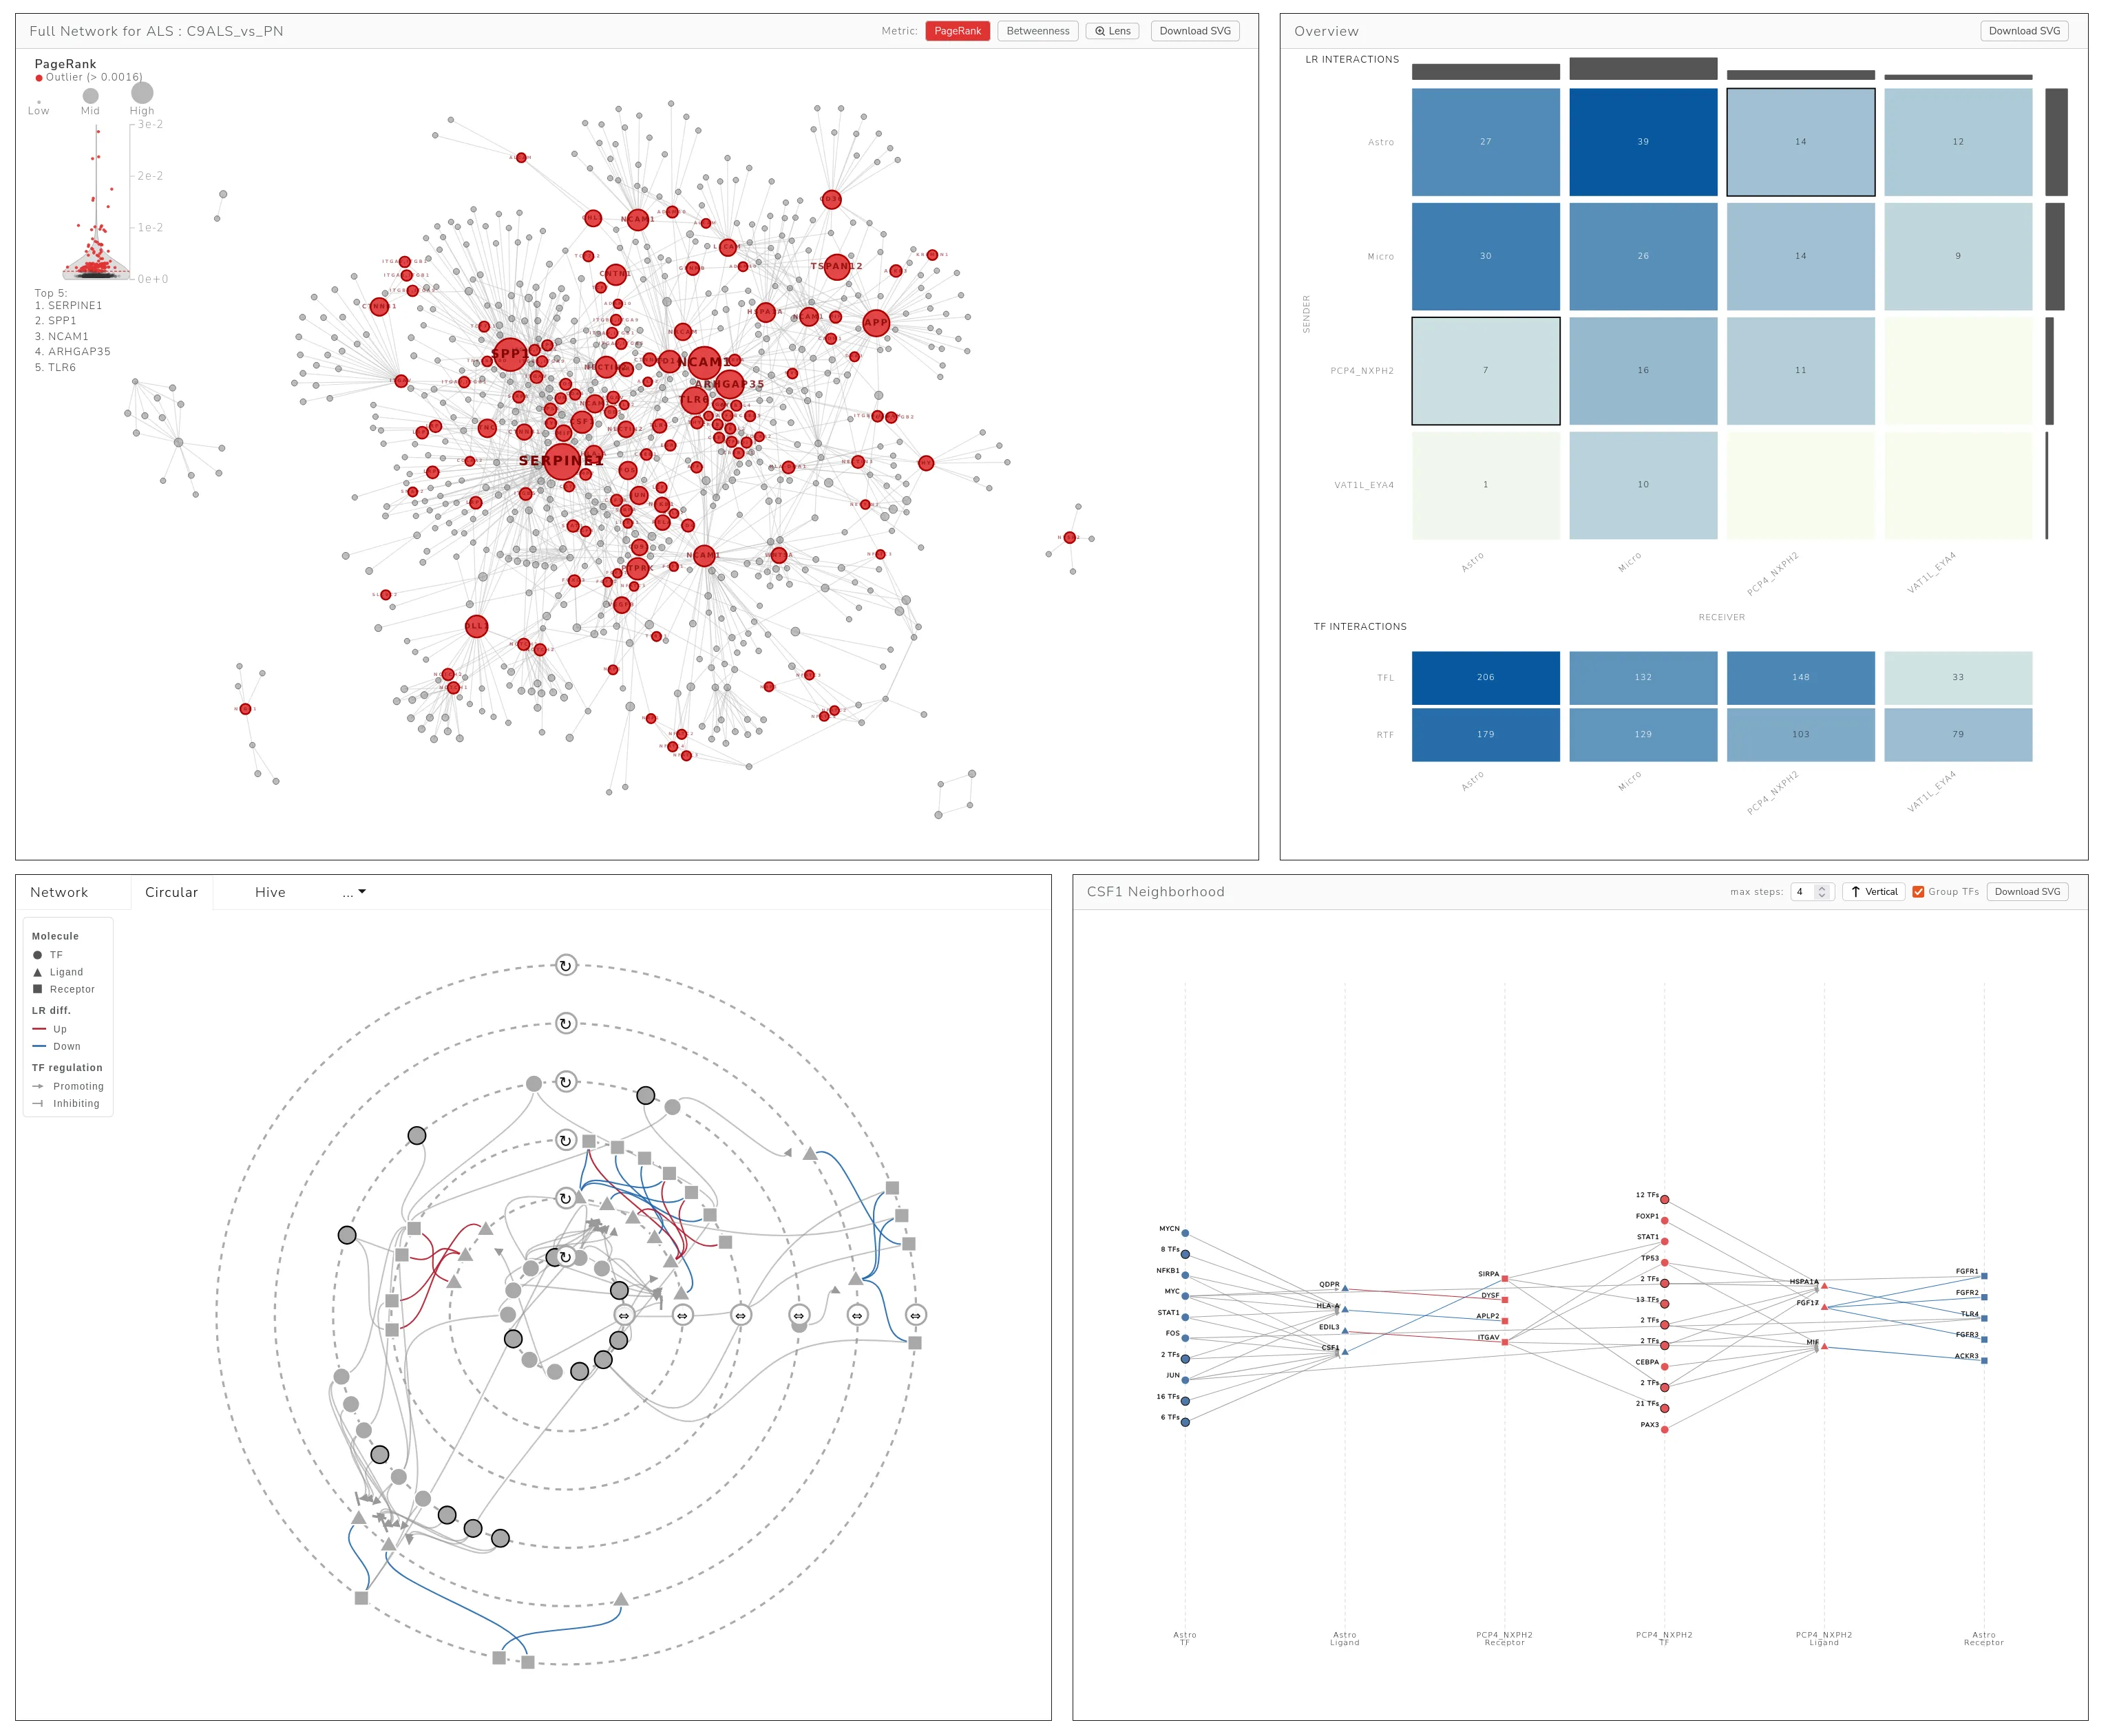
The dashboard integrates intercellular communication, intracellular signaling cascades, TF regulation, and functional enrichment analysis into a unified multi-layer network representation supporting the identification of candidate disease drivers, altered signaling loops, and dysregulated regulatory programs.
Graphical Abstract

Features
- Multi-layer signaling network visualization
- Coordinated interactive views
- Differential CCC exploration
- TF activity integration
- Signaling loop identification
- Functional enrichment analysis
Case Studies
The dashboard currently includes:
- Amyotrophic Lateral Sclerosis (ALS)
- familial ALS vs pathologically normal (C9ALS_vs_PN)
- sporadic ALS vs pathologically normal (SALS_vs_PN)
- sporadic ALS vs familial ALS (SALS_vs_C9ALS)
- Fibromuscular Dysplasia (FMD) Ko mouse model vs wildtype (Ko_vs_Wt)
Technology Stack
- Frontend: Svelte + D3.js
- Backend: Python + FastAPI
- Database: PostgreSQL