
Neurodegen-Vis
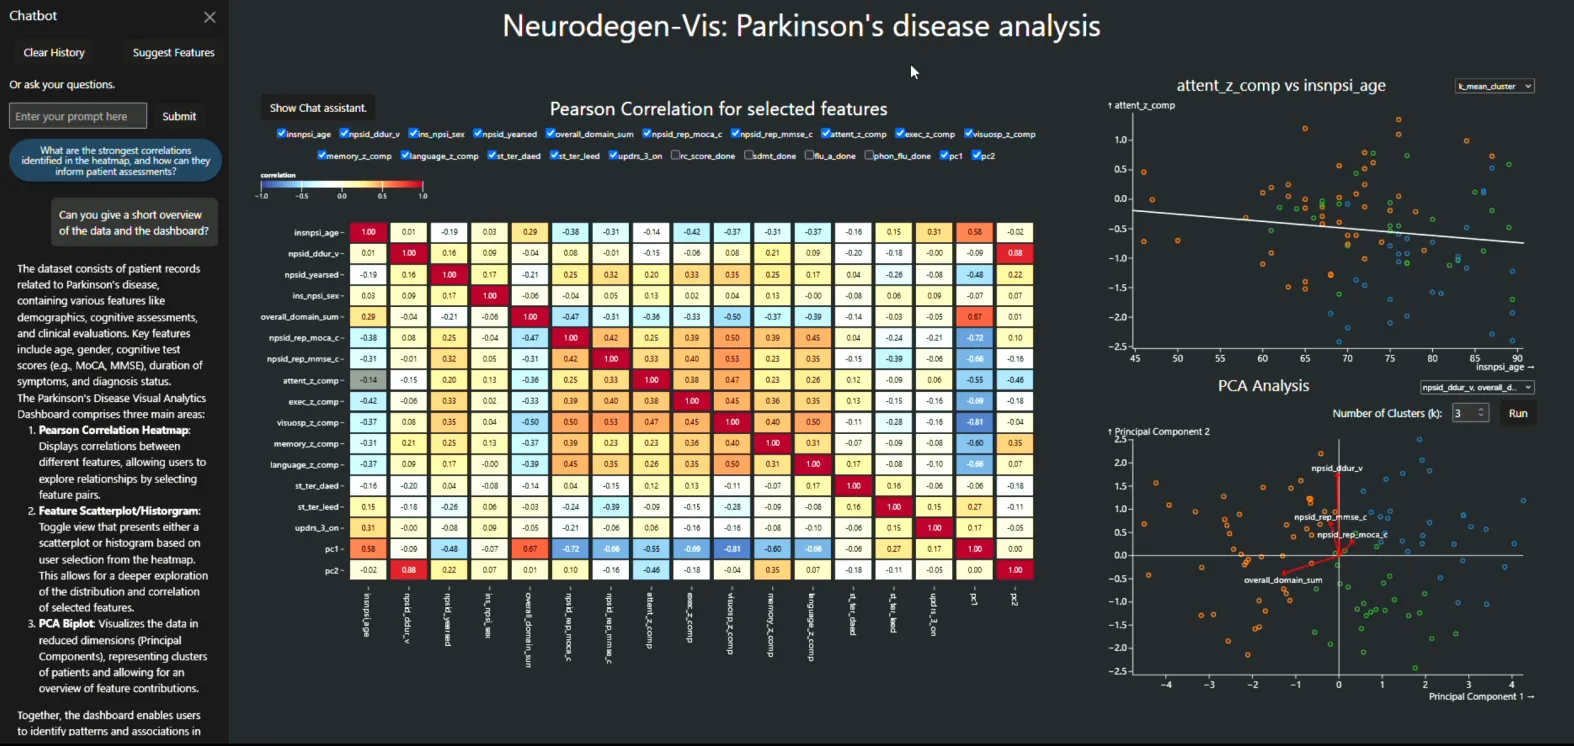
Healthcare records, measurements and datasets can quickly become highly complex in terms of storage, anonymisation and interpretation. With Neurodegen-Vis, we present a practical toolkit to anonymise, visualise and help interpret medical data in a Visual Analytics dashboard, with seamless integration of a Large Language Model (LLM).
Neurodegen-Vis



Welcome to Neurodegen-Vis, the code behind Privacy-Preserving Visual Exploration of Healthcare Data with a Language Model Integration, published in the Joint Proceedings of the ECAI 2025 Workshops XAI-KRKG and UCEX-XAI (CEUR-WS Vol-4172).
Demo · Paper · TU Graz research portal

Research use only. Not a medical device. See DISCLAIMER.md for intended use, data provenance and limitations.
Overview
Neurodegen-Vis is a visual analytics tool for exploring correlations and dependencies in tabular patient data. Instead of patient records, the dashboard shows synthetic data generated with differential privacy, and an integrated Large Language Model helps users interpret the data and navigate the dashboard.
Key Features
- Privacy-First Analytics: The dashboard shows a synthetic table instead of the source cohort. Direct identifiers are removed, and the categorical columns and the correlation matrix are generated with differential privacy (MWEM, OpenDP SmartNoise). The continuous columns are sampled from fitted distributions whose parameters are not noised, so the formal guarantee covers only part of the table (see DISCLAIMER.md).
- Dataset: The example dataset is derived from a Parkinson's disease cohort with demographic information, cognitive test results and treatment data.
- LLM Assistance: An integrated chatbot acts as a co-pilot to help users understand, explore, and analyze the dashboard and the underlying data:
- Context Awareness: The model is aware of the dashboard's visualizations, interactions, feature descriptions, and correlation results.
- Automatically Updated Visualizations: Interacting with the chatbot dynamically updates the UI. For example:
- Highlighting specific heatmap cells and switching to the corresponding scatterplot when discussing correlation results.
- Switching to the corresponding histogram view when asked about feature explanations or distributions.
- Exploration: Using the Suggest Features function proposes feature dependencies that could be interesting to analyze and automatically updates the scatterplot accordingly.
Data
The source data is a project-internal Parkinson's disease cohort of the University of Padua; it is not published and not part of this repository.
The dashboard only ever loads the differentially private synthetic table (100 rows), which the frontend reads from database/noisy.csv under its base path.
It is not in the current tree, but is kept in the git history; to run the dashboard locally, restore it with
mkdir -p frontend/public/database
git show d3a0070:frontend/public/databases/noisy.csv > frontend/public/database/noisy.csv
Running locally
If you just want to try the dashboard, use the demo server. To run it yourself:
- Configure the language model in a
.envfile - Change the URL base path in
frontend/vite.config.ts - Build and start the Docker containers
1. Configure the language model
Create a .env file in the repository root with an API key and the SERVER flag:
#.env
OPENAI_API_KEY=sk-proj-...
SERVER=false
With SERVER=false the backend sends chat requests to the OpenAI API (gpt-4o-mini), a provider outside the EU/EEA.
The demo server uses SERVER=true, which routes them to a self-hosted model at TU Graz instead.
2. Change the URL base path
In frontend/vite.config.ts, change
  // Deployment on Demo Server.
  base: "/neurodegen-vis",

  // // to run locally via Docker, uncomment the following line:
  // base: "./",
to
  // Deployment on Demo Server.
  // base: "/neurodegen-vis",

  // // to run locally via Docker, uncomment the following line:
  base: "./",
3. Build and start
docker compose up --build
Citation
If you found this work helpful, please cite:
@inproceedings{2025-neurodegen-vis,
	booktitle = {Joint Proceedings of the ECAI 2025 Workshops XAI-KRKG and UCEX-XAI},
	series    = {CEUR Workshop Proceedings},
	volume    = {4172},
	title     = {{Privacy-Preserving Visual Exploration of Healthcare Data with a Language Model Integration}},
	author    = {Grabner, Michael and Waldert, Peter and Kantz, Benedikt and Schreck, Tobias},
	year      = {2025},
	pages     = {109--118},
	url       = {https://ceur-ws.org/Vol-4172/paper1.pdf}
}
Acknowledgement

Funded by the European Union under grant agreement No 101137074 (HEREDITARY). Views and opinions expressed are however those of the author(s) only and do not necessarily reflect those of the European Union or the European Health and Digital Executive Agency (HaDEA). Neither the European Union nor the granting authority can be held responsible for them.
License
MIT, see LICENSE.